What is FoodHUD?
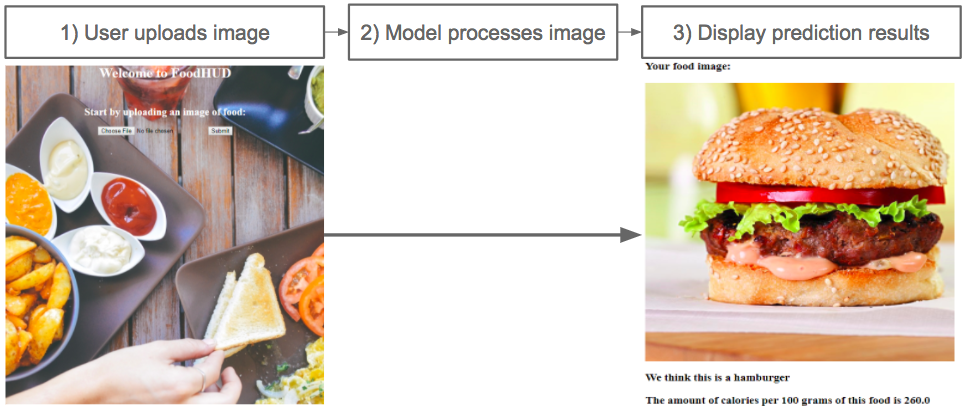
FoodHUD, the Food Heads-Up Display, is an easy-to-use web application where a user uploads an image of food and then receives the name of the food along with an estimate of the caloric content of the food for every 100 grams of it. We call this the "Caloric Density" of the food.
Background motivation
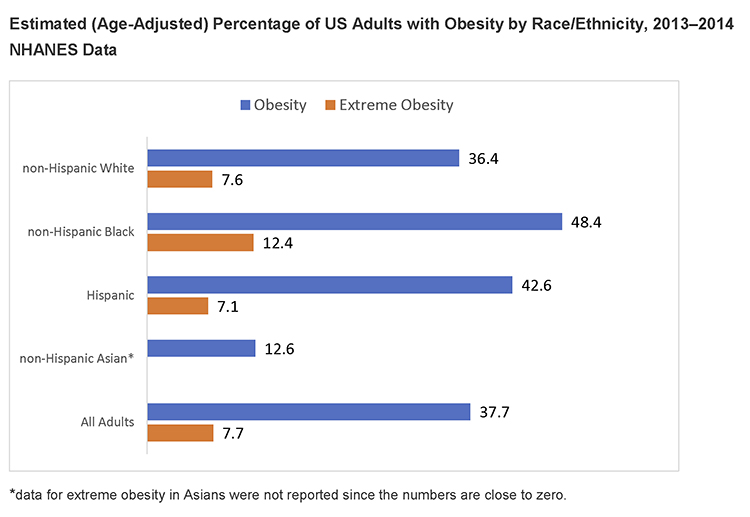
Millions of Americans struggle with their weight and its effects on their physical health. Portion control can be a serious challenge for busy people, and often it is difficult for someone to estimate the caloric content of a given meal. While a human would often fail at the task, a well-trained machine may not.
Recent advances in computer vision, driven by developments in deep learning, have enabled computers to successfully distinguish thousands of classes of images of items with impressive accuracy. Researchers have already developed image classification data sets comprised of images of food.
One such data set, Food101, contains 101 classes of food with 1000 high-resolution images for each class. Several well-established baselines exist for Food101, including relatively performant deep learning solutions. This provides a proof of concept that the automated identification of food is within our grasp, and these solutions may provide a path forward for Americans seeking to reign in their caloric intake.
How we made FoodHUD
Inspired by the progress made on the Food101 data set, we set out to implement an automated tool to estimate the caloric content of a plate of food based on an image. We believe that such a product, available as a web-based application or preferably a mobile application, could bolster a consumer’s ability to control their diet and be more health- and nutrition-conscious.
We developed our solution in multiple parallel stages. We knew that we needed to acquire not only labelled image data of foods, but also coinciding nutritional data on those same foods. We have already discussed Food101 as a data source, but we explored additional options to augment this source with more images. Knowing that we would need to integrate caloric data at a minimum, we search for and evaluated a few different sources of nutritional information. We chose to update the neural network architecture to reflect our augmented data set. Finally, we needed to create an application to leverage our deep learning model and perform class identification and use a lookup table to derive calorie prediction.
Image Set Augmentation
Although the existing Food101 dataset offered a laudable 1000 images per class, we suspected that we would benefit from an augmented data set (e.g. more images, more classes). To that end, we explored a few additional data sources, including pre-compiled data sets and public image sites. Namely, we considered integrating data from the UEC data set, which could have supplied more images and additional classes for us. However, these classes seemed skewed toward Japanese cuisine, which would have been less beneficial for a typical American dieter.
We also attempted to scrape images from Google Images, Instagram, and Flickr. We found a useful Chrome extension for Google Images, but the functionality had bugs and daily throughput was limited. Instagram's API was incredibly limited as it required direct approval from Instagram before use and approval was limited to applications with purposes other than data collection. Flickr's API was the overall best option for automated food image collection. It allowed for the automated collection of thousands of images based on keyword search. The searches led to relatively high-quality results. Searching for "apple pie" resulting in a very large ratio of valid apple pie images (roughly 90% were valid by eye). We had hoped to retrain a CNN on a larger image set obtained this way, however time constraints made it impossible. It is also unclear if the invalid images (roughly 10% of the data) would destroy any gains to be had from the increased data volume.
We also considered automated data augmentation of our existing image set, through cropping and reflections. This would allow us to expand our image set from the existing Food101 data set without worrying about data quality and accuracy. We found source code that augmented an image set, but we opted not use it due to time constraints. Their implementation would have required more RAM than our systems had, and we could not spare the time to implement our own.
Nutritional Information Acquisition
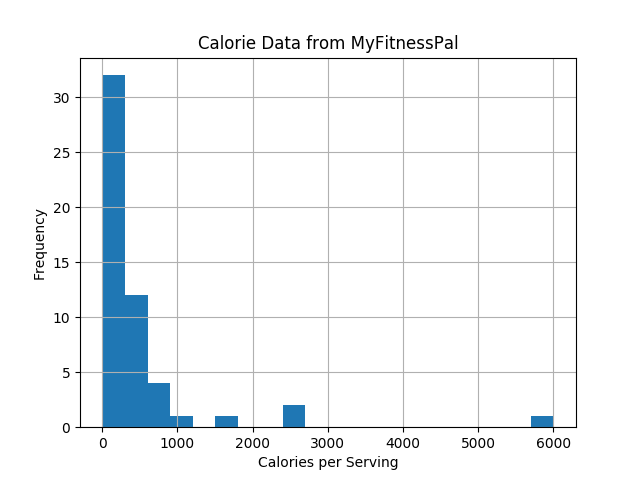
Because we wanted to predict calorie data about a food, we needed a reliable and open resource for nutritional information. Initially, we sought to use MyFitnessPal as a data source. It seemed reliable enough, and all of the Food101 categories had at least one relevant entry in its nutritional database. However, due to MyFitnessPal’s policy against automated collection of data, we chose to collect it by hand, which was cumbersome. Because of this, we only took one data point for each category, which resulted in quite a few categories that had anomalous calorie values. These anomalies, as well as the fact that MyFitnessPal is not a truly open resource, led us to discard MyFitnessPal as a data source.
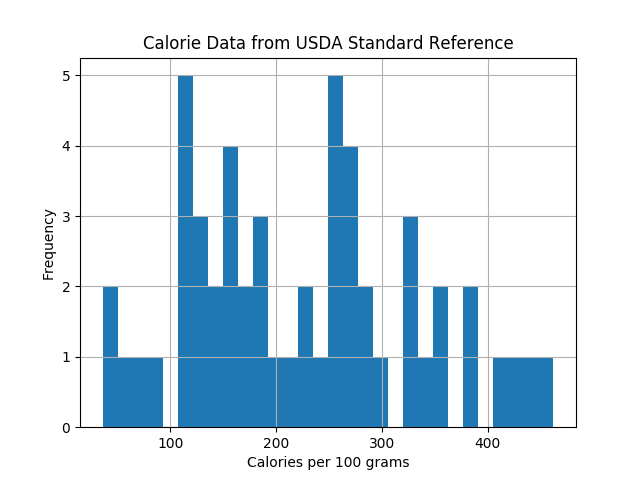
Fortunately, we found a reasonable public data source in the USDA National Nutrient Database for Standard Reference. This provides nutrient data about nearly 9000 foods, many of which overlap with the food categories in Food101. Using the caloric information from this data source and a handy set of regular expressions, we were able to compute the median caloric density (kcal/100g) for 53 of the original 101 food categories in Food101. These calorie values seem valid and will allow us to integrate nutritional data into our application.
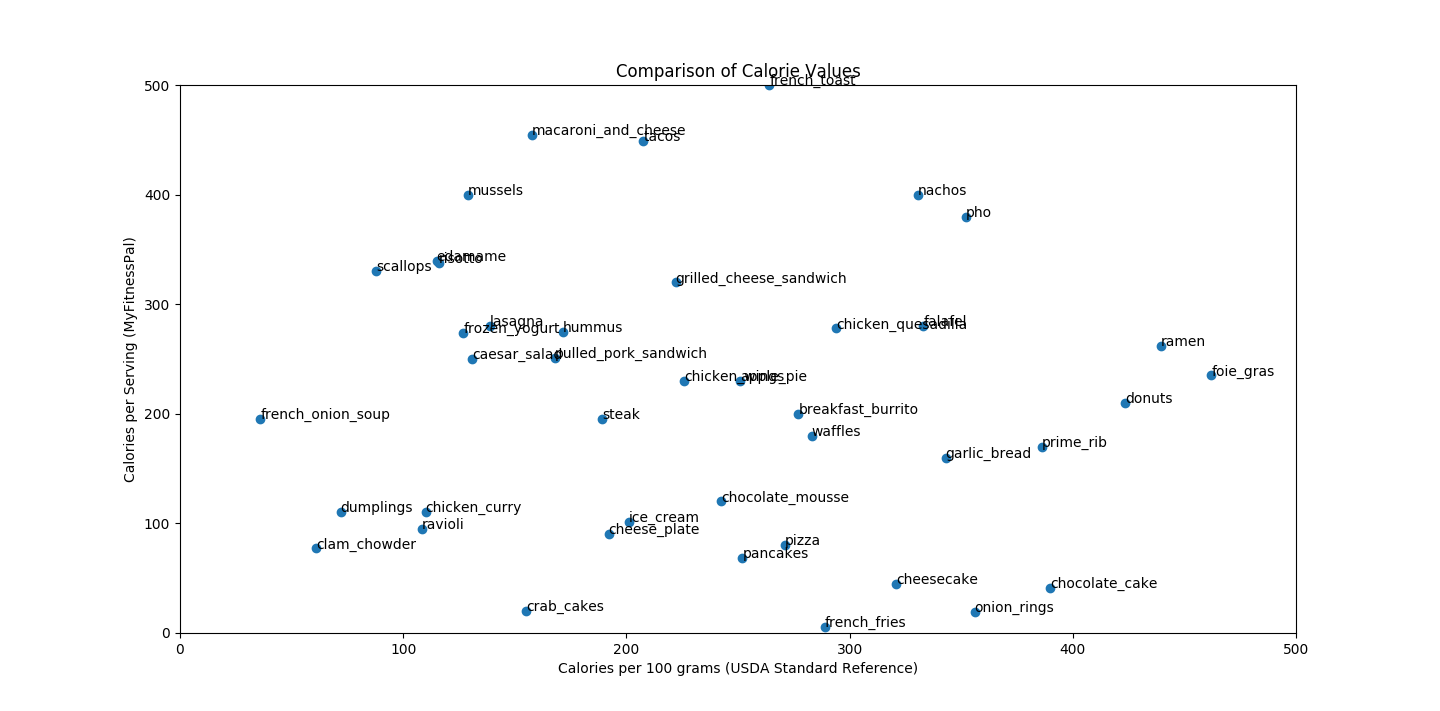
The distributions seem to suggest that MyFitnessPal's "per serving" calorie values and USDA's "per 100 grams" calorie values are similar. However there are a couple of issues.
First, here we see that there are some issues with the calorie values for foods in MyFitnessPal:
Compared to the relatively stable distribution found from USDA:
Second, we fail to see a linear relationship between "per serving" and "caloric density" in the data plotted here:
Modeling
Classification Modeling
InceptionV3 ImageNet CNN retrained on Food101 images.
Here is a high level view of the InceptionV3 CNN model architecture:
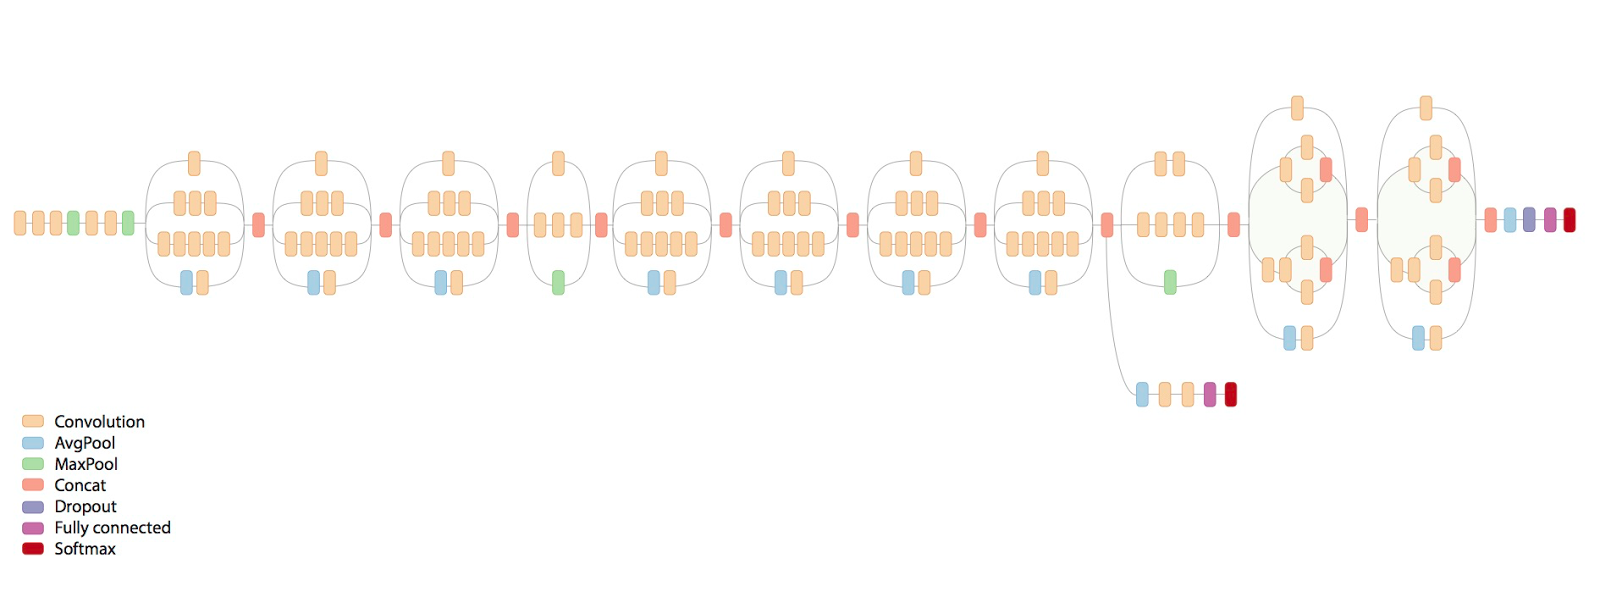
See resouces [4] [6] for more information.
Regression Modeling
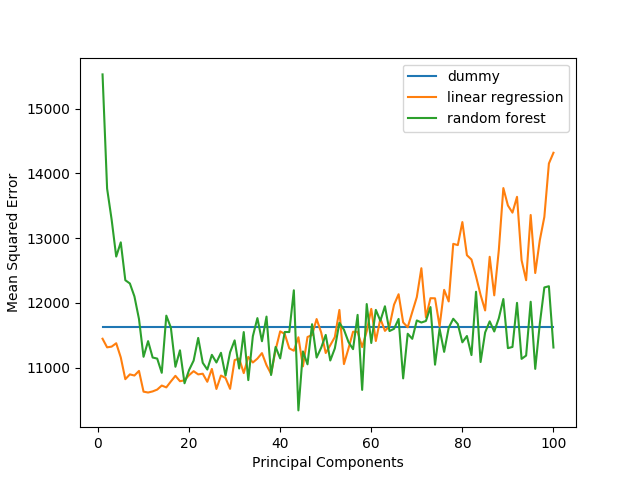
Our final architecture used classification and then looked up the median caloric density based on the class. However, we were also interested in determining the performance of the model when attempting to use linear regression to predict the caloric density directly. We ran an experiment with a subset of 1000 of the Food101 images, filtering down to those images belonging to the 53 classes for which we had caloric densities. Then, resizing the images, we collected features for each image from the Keras application for the VGG16 network trained on ImageNet. We then fed these features into a PCA with a number of principal components varying from 1 to 100 and used a 5-fold cross-validation to compute a mean squared error. We used a much simpler model as our baseline, whose only input features were the sums across all pixels of each of the three color channels. This three-feature model performed comparably with models trained on the PCA transformation of the extracted image features.
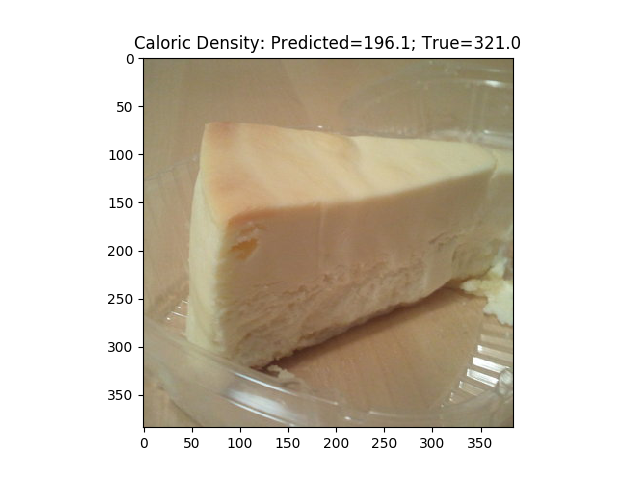
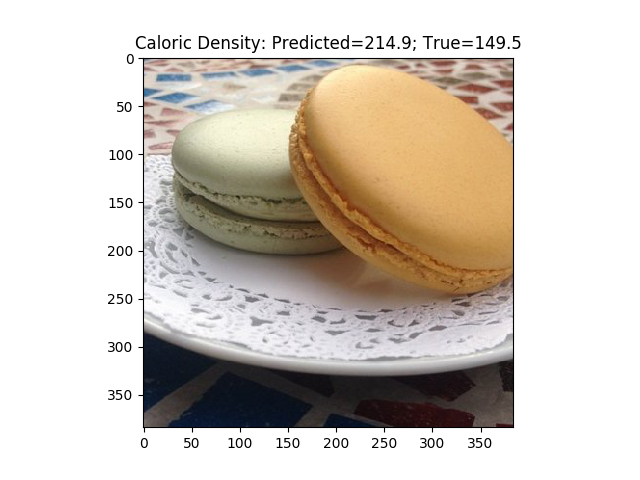
Additional models were also tested, including a "dummy", which only guessed the mean caloric density of the training data, and a random forest. Neither the linear regression nor the random forest significantly outperformed the dummy. These results together suggest that direct regression of caloric density is not a reasonable option for models trained on this subset of Food101.
Web-Based Application
Using Python's Flask library and Google's Cloud services, we established a web application capable of serving Keras model predictions based on user provided content. A demo can be found here (not currently working!). The user uploads an image and after it is processed, both a food category and nutritional information is displayed with the image.
Here is an example of that workflow: